This chapter introduces QUANTA and its features. It describes the basic design, layout, and flow of the program and procedures for getting started. Read this chapter to learn or to review how to get into QUANTA and how to use its basic tools.
Abbreviated information on how to start and run QUANTA also is included in the front matter of the two other books in this set, Generating and Displaying Molecules and Simulation, Search, and Analysis.
The QUANTA manuals, CHARMm documents, and various tutorials are accessible from the menu function Information/Help. In addition, interactive help for some palette tools and menu bar items can be turned on with the SET HELP command or by clicking the palette or menu with the right mouse button.
By default, online help starts a browser. It is therefore necessary for the command "netscape" to exist in your path. Use the UNIX command
> which netscape
to see if this is true. Alternatively, help text can be displayed in the textport. This can be specified using the SET HELP command, but it happens automatically if Netscape cannot be started. Only text is printed to the textport - HTML formatting, graphics, table layout, etc. are of course lost.
QUANTA uses standard windows and menus in its interface. Most QUANTA processes are initiated by selecting choices from the menu bar. This bar is located at the top of the Molecule window that is displayed at program startup.
In general, as you move from left to right on the menu bar, you move from housekeeping functions through structure creation and editing functions, to simulation and analysis functions. Optional application choices such as Protein Design are located at the lower end of the Applications menu.
QUANTA runs under the UNIX operating system. There are several methods to access the operating system and perform system functions without exiting from QUANTA.
QUANTA functions can be organized into four broad categories: structure import and creation, structure editing, simulation, and analysis. Each category involves inputting data, manipulating or operating on the data, and outputting new or revised data.
Structures from external databases or structures created with other applications are imported into QUANTA using the Import selection in the File menu. Structures are created in QUANTA using one of the Builder choices in the Applications menu: 2D Sketcher (ChemNote®), 3D Builder (Molecular Editor), Sequence Builder, or Nucleic Acid Builder. Molecules also can be constructed using one of the optional builders that you may have purchased with QUANTA.
Editing involves making changes to a structure. QUANTA provides editing tools that can modify structures to fit your criteria. Capabilities of these tools include:
Editing mainly occurs in the Molecular Editor, which is selected from the top of the Edit menu. Editing also occurs as torsion angles are determined as part of a conformational search.
QUANTA also offers many display options that allow you to choose how to graphically represent a molecule. Most display options are available through the Draw menu. These options are not editing tools. They do not determine what portions of a structure are active during QUANTA operations. They do determine how you see a structure or portion of a structure.
The display tools within the program allow you to:
Simulations include energy minimization calculations, dynamics and dynamics animation, hydrogen bond calculations, conformational search, solid docking, and molecular similarity processes. CHARMm®, a computational chemistry program developed at Harvard University has been incorporated into QUANTA as the main calculation engine. Thus, many QUANTA processes are launched from the CHARMm menu. Other simulation choices are located in the Calculate and Applications menus.
The analysis function resides in the Applications menu and is applied to the results of simulation processes, such as dynamic animation and conformational search.
QUANTA menus also contain housekeeping functions, including setup and display choices. The Preferences menu includes functions for tailoring general operations of the program, such as color definitions, output settings, and MSF saving options. Selections in the View menu determine general viewing parameters.
All files and directory structures are organized by user-assigned names. Regardless of how a structure is created, information about it is stored in a molecular structure file or MSF. Filenames are written filename.msf, where filename stands for whatever name you give any file. An MSF contains at least this basic information:
Other information, such as solvent accessibility, thermal mobility, and electrostatic potential may be added to an MSF.
Naming of files converted to MSFs is controlled in the Molecular Modeling application by the MSF Automatic File Name Generation function. Options for saving files are available in the Preferences menu under the MSF Settings selection.
You will encounter other file types as you work with QUANTA. Ones that are frequently created or used include:
The .cst file also encapsulates other files that are used during a QUANTA run. For example, a file such as the color selection file .csf is copied into the .cst file at the end of each session, and the separate file is deleted. When you start a new session, the .csf file is re-created. This reduces the number of saved file and makes it easier to transfer work to another directory.
The information on this 3D grid is stored in bricks. The overall grid is divided into 6 x 6 x 6 pieces, and the data for each brick is stored in a single direct-access record. This approach increases the speed and flexibility of selecting and retrieving portions of a complete map for contouring. In practice, bricks overlap one another on one edge to ensure that a continuous surface is generated in contouring.
The header of the brick map file contains all the information about the contents of the file. QUANTA reads brick map files generated by earlier versions of the program.
You must have a licensed copy of QUANTA installed on your system before you can start the program. Several environment variables must also be defined. If you have difficulties in either of these areas, please check with your system administrator.
The first step in getting started with QUANTA is to create several subdirectories, each able to run QUANTA, within your UNIX directory. This permits the datafiles generated by QUANTA to be organized systematically. Create a new subdirectory each time you begin a new QUANTA project.
Each subdirectory should contain a separate QUANTA environment that consists of:
To establish a working area for these tutorial exercises:
Move the mouse so the cursor is located in a shell window. Enter the text:
QUANTA is started from the accelrys_quanta directory for all tutorial exercises in the QUANTA documentation set. QUANTA should not be run from a console window. The console window is reserved for system messages.
2. Move into your accelrys_quanta subdirectory.
3. Copy a sample structure file to the accelrys_quanta subdirectory.
With the mouse cursor in the shell window, enter:
> chmod u+w PEPTIDE.msf
QNT ROOT: Undefined variable
When this step is complete, the directory is ready for starting QUANTA.
When QUANTA is started, the program automatically opens in Molecular Modeling mode.
To start QUANTA for the first time:
You see a dialog box stating that the accelrys_quanta directory does not contain the necessary startup files. You see this dialog box whenever you run QUANTA for the first time in a new directory or if you have deleted your .cst file. The startup files contain setup information.
2. Create the necessary startup files.
Move the mouse so that the cursor is located over the rectangle in the dialog box containing the word Yes (in other words, the Yes button). Click the left mouse button. The dialog box is removed from the screen, and the necessary startup files are created. Selecting No in this dialog box exits QUANTA without creating files.
QUANTA enters Molecular Modeling mode, and the QUANTA Molecule window, textport, Molecule Management table, a dial emulator, and several palettes are displayed. If the QUANTA windows are not displayed, ask your system administrator for help in defining the environment or creating a license.
When you start QUANTA from a directory that was used earlier for QUANTA, the program automatically loads the last structure used in the most recent session in that directory.
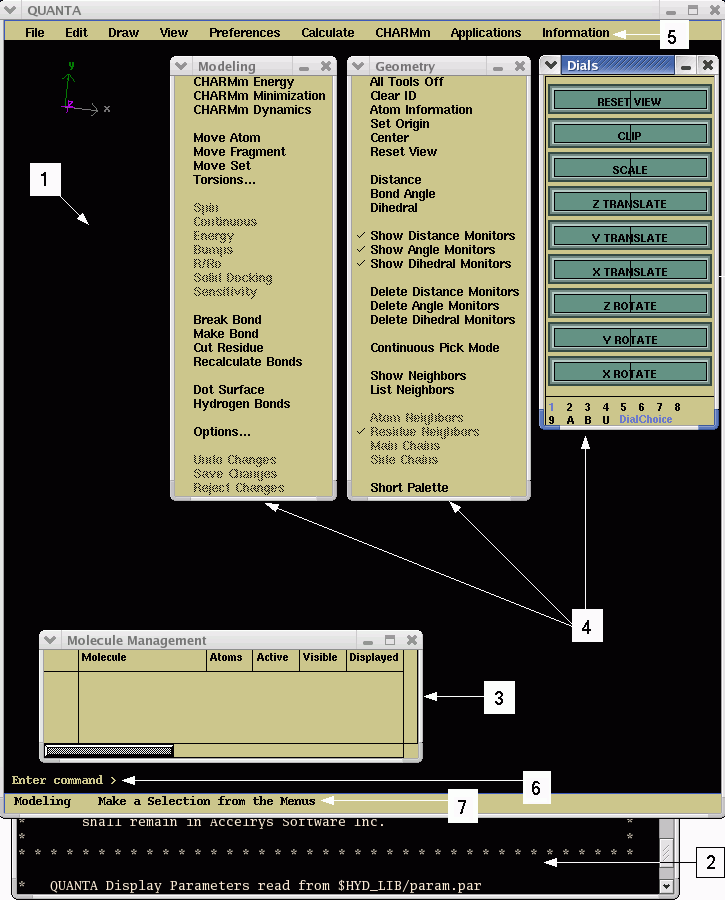
There are four types of windows in the basic QUANTA display:
3. Molecule Management Table window.
4. Palettes and Emulator windows.
The windows are labeled numerically below.
These windows provide access to the functions and tools required to manipulate structures or provide status messages about the execution of various procedures and calculations. Some QUANTA applications use different windows to accommodate specific application-related tasks.
Tools for manipulating a QUANTA window can be accessed by placing the cursor on the button in the top-left corner of the window title bar and pressing the right mouse button to display a pulldown menu. Generally, you can size, move, or hide a window by selecting an item from this menu. Palette windows cannot be resized.
When you iconify the Molecule Window in QUANTA, all displayed windows except the textport are closed. A single QUANTA icon is displayed. All the windows are redisplayed when the Molecule Window is redisplayed. Any other window can be iconified by itself.
The Molecule window is a resizable window that contains the following areas, in addition to the visualization pane:
Each area is labeled numerically above.
A molecular structure is displayed in the viewing area. After initial startup, QUANTA displays the last structure used in the previous session. In the upper-left corner of the viewing area, the x, y, and z axes show the orientation of a displayed structure in 3D coordinate space. These axes move with the motion of a displayed structure.
The menu bar contains nine menus from which various QUANTA functions and external programs can be accessed. Table 1 lists the menu titles and describes the functions contained in each. See Appendix A for a complete list of menu choices and function descriptions.
You can enter specific QUANTA commands on the command line located directly under the viewing area. By using the command line, you can bypass menus and palettes and send instructions directly to QUANTA or the operating system. Commands cannot be entered when a dialog box is open. Refer to the QUANTA Command Dictionary for more information on command-driven QUANTA.
The message line is located directly under the command line. During QUANTA operations, this area displays instructions and error messages.
The textport is a scrollable, resizable window that displays QUANTA operational messages and information about displayed structures. For example, a message may list the atoms contained in the displayed structure, confirm picking of an atom in the viewing area, or transmit an error message.
The textport window can be manipulated using standard window manipulation procedures.
The Molecule Management table, which is displayed below the Molecule window, reports basic information about open MSFs. It also can be used to manipulate various aspects of a structure's display.
Whether each MSF is active, i.e., if computational operations can be performed on it | |
When you start QUANTA, the Molecule Management table lists the last structure and setting used in the previous QUANTA session.
The default size of the table includes the first four or five columns; to access the others, resize the window or scroll horizontally using the scrollbar at the bottom of the table window.
As each MSF is opened, a row is created for it at the bottom of the table. MSFs are listed in the order they are opened. Rows are removed from the table when MSFs are closed. The default table size enables the first three or four rows to be viewed; resize the window or scroll down using the bar at the right of the table window to access any others.
The table can be shown or hidden with the Molecule Management table toggle in the Draw/Manage Display dialog box. It can also be manipulated using standard window manipulation procedures.
The Molecule Management table is operated by single or double clicks in the cells and column headers, providing various textual and graphical effects.
Palettes appear automatically, usually to the right of the viewing area, when an appropriate choice from a QUANTA menu is selected. Each palette is contained in a window. Generally, a palette contains a collection of related tools in a menu format. Selecting a palette item can open additional palettes or dialog boxes. Manipulation and behavior of palette windows is similar to that of other windows, except that palette windows cannot be resized.
Selection of tools in palettes can make other tools unavailable or make previously unavailable tools available. A selected tool is always checked and highlighted, indicating it is active. Some tools remain active unless they are manually turned off. Other tools are automatically turned off when a process is completed.
Tools that are dimmed (gray) on a palette are either not available or are inappropriate for the work you are doing. A tool cannot be selected when dimmed. This prevents you from making an inappropriate choice. A dimmed tool may be restored to available status when it is toggled by the selection of another palette tool.
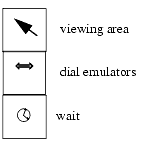
The dial emulator is contained in a window in the lower right corner of the QUANTA startup screen. It is equivalent to mechanically operated buttons or dials, but operated by clicking with the mouse. The dial emulator window can be manipulated using standard window management procedures.
The dial emulator contains a family of dial sets numbered 1-9, A, B, and U. A particular dial emulator set can be selected by clicking the left mouse button when the cursor is over the appropriate number or letter at the bottom of the palette.
There are two types of dial emulators, global and task-specific. The global dials in Dial Set 1 control rotation, translation, scaling, and clipping for all structures in open MSFs. You can check the Molecule Management table to determine what MSFs are open.
Task-specific dials (Dial Sets 2-9, A, B, and U) control transformations for specific sections of structures, atom colors and labels, menu colors, dynamics, comparison flashing, and settings for various functions. Some dial sets, such as Dial Set 2, Fragment and Set Transformation, are automatically opened when an appropriate palette selection is made.
Table 4 provides a complete list of dial emulators. Many of the dials have mouse and keyboard equivalents that are also listed
Most QUANTA operations can be performed with the mouse. The mouse is used to position the cursor at a location in the window, select items in a window, and move a displayed structure.
There are two methods of operating mouse buttons; both use the left button most of the time. The first method is a single click of the button, that is, press and release. For example, making a selection in a dialog box requires a single click of the left mouse button.
The second method is to press and hold the button while moving (or dragging) the mouse to move the cursor. For example, selecting a menu function requires pressing then holding the left mouse button to display a menu, then moving the cursor down to highlight a selection. Releasing the mouse button completes the selection of the function.
The cursor changes appearance as it moves to different window locations, indicating the type of operation in progress or required.
Practice mouse techniques with this exercise:
Move the mouse so the cursor is over the viewing area, then move the cursor over the dial emulators. The appearance of the cursor changes in each area.
Move the mouse so the cursor is located over the title bar of the Geometry palette located behind the Modeling palette. Click the left mouse button. The Geometry palette pops in front of the Modeling palette.
Move the mouse so the cursor is located over the title bar of the Modeling palette. Click the left mouse button. The Modeling palette pops in front of the Geometry palette.
The QUANTA interface contains a set of menus to simplify the use of QUANTA. Each menu contains a group of related functions. Selecting a function can cause a dialog box or a new palette to be displayed.
QUANTA provides three types of menus: pulldown, pull-right, and sticky. Any menu can be used as either a pulldown or sticky menu, depending on how you display it. Pull-right menus are accessed from pulldown and sticky menus.
Some menus or menu choices are dimmed (gray) when the operations in which QUANTA is engaged make those choices inappropriate or if they access applications for which you do not have a valid license.
Complete the following three exercises to learn how to use the three menu types. The first exercise involves pulldown menus.
1. Display the File menu as a pulldown menu.
Move the mouse so the cursor is over the word File in the menu bar. Press and hold the left mouse button. The contents of the File menu are displayed as a pulldown menu.
With the mouse still over the word File in the menu bar, release the button. The File menu is closed.
2. Display other menus as pulldown menus.
Display the File menu again. Continue to press and hold the mouse button as you slowly move the cursor to the right over the other names in the menu bar.
The contents of each menu are displayed as the cursor is moved. As one menu opens, the previously displayed menu closes.
3. Display menu function information in the message line.
Continue to press and hold the mouse button and move the cursor down over the Open function, the first item in the File menu. When the cursor is on the selection, it is highlighted.
With the function name highlighted, look at the message line at the bottom of the viewing area.
Select MSFs to Open
is displayed, providing information or directions that apply to the highlighted selection. Messages are also displayed for selections from sticky and pull-right menus.
Move the cursor away from the menu so that no selections are highlighted and release the mouse button. The File menu is closed and no function is selected. Repeat this procedure as often as you like to get information on any menu item.
The following exercise involves pull-right menus.
Go to the View menu and display it. Highlight the menu item Window Layout. This item has an arrow to its right. When the item is highlighted, its pull-right menu is automatically displayed.
2. Make a selection from a pull-right menu.
Still holding the mouse button down, move the cursor into the pull-right menu and select the item Full Screen. Release the button to complete the selection. The Molecule window expands to occupy the full screen.
Reduce the window to its previous size by repeating the selection process, selecting Default Screen from the Window Layout menu.
The following exercise involves sticky menus.
By default, the Sticky Menu preference is off. To change the preference, go to the Preferences menu and highlight the Sticky Menu selection. A pull-right menu is displayed. Select On in the pull-right menu and release the mouse button.
2. Display the View menu as a sticky menu.
Select the View menu in the menu bar by clicking once quickly with the left mouse button. A window containing the View menu opens and remains displayed.
3. Display a pull-right menu as a sticky menu.
From the View menu, select Window Layout. The Window Layout pull-right menu opens and remains displayed. Window Layout remains highlighted in the View menu.
In the View menu, select Window Layout again. The Window Layout menu is closed. Select View from the menu bar. The View menu is closed.
You can close the View menu, leaving only the Window Layout menu displayed. When the View menu is closed, iconify the Window Layout menu by selecting the icon in the upper-right corner of the menu title bar. The menu icon is displayed briefly, then removed from the screen.
Some menu and palette selections require additional information before a requested procedure can be executed. The additional information typically is needed to define conditions for carrying out a function. QUANTA automatically asks for additional information in these cases by displaying a palette or dialog box.
When you enter the required information in a dialog box and confirm your response by selecting an action button, QUANTA completes the procedure. A Cancel button is provided in most dialog boxes so that you can return to the menu or palette that called the dialog box without completing the procedure.
Some functions use more than one level of dialog boxes. Successive boxes are displayed until all the information required for the initially selected function is specified or the function is cancelled.
Dialog boxes ask for information using a variety of tools including options, data entry fields, and scrolling lists. Combinations of tools may be contained in a single dialog box.
When a dialog box is displayed, one or more options may already be selected. These defaults are the choices that are used most often and are displayed with the selection filled or marked by a thicker line around the button.
Three different types of options can be present in a dialog box. Each option permits the selection of a condition or action, but each has different features and constraints.
Action buttons generally exist in pairs. Selecting one of the buttons results in action being taken. For example, information is saved and the dialog box is closed. Selecting the other button results in a different, often opposite, action being taken. For example, information is not saved and the dialog box is closed.
For each type of option, a default selection has been made in the illustrated dialog box.
Data-entry boxes provide space for you to supply information. When a particular data-entry box is highlighted, information can be entered from the keyboard. Data can consist of text, numbers, or a combination of both. Several examples of data-entry fields are shown in the Modeling Options dialog box above.
Entered data must meet certain requirements to be read into QUANTA. For example:
Most text entries in QUANTA, with the exception of filenames, are case insensitive. Filenames are governed by standard UNIX conventions.
If the entered data violates these requirements when an action button is selected, QUANTA reports an error in the textport and does not close the dialog box until additions, deletions, or corrections are made in the data-entry box to correct the error. Errors made during input can be erased using the <Backspace> key when the data entry box is highlighted.
A scrolling list consists of a set of items, typically filenames and directories. Most scrolling lists permit the selection of only one item at a time.
To scroll down an increment, click the left mouse button anywhere in the scroll area. To scroll up, click the right mouse button anywhere in the scroll area. To scroll up or down, click above or below the scroll bar with the middle mouse button.
The following short procedure demonstrates the use of an action button:
1. Select the About QUANTA function from the Information menu.
Display the Information menu and select About QUANTA. A dialog box describing the QUANTA release is displayed.
2. Select the Continue button.
Select the Continue button at the bottom of the dialog box. The button is briefly highlighted, indicating it is selected. The dialog box is closed.
The File Librarian is used for selecting files in QUANTA. It lists files in your working directory or in other directories on the network. You can select a file by typing the filename into a data entry box or by clicking the filename in the list to insert the desired name into the data entry box.
A File Librarian dialog box contains several selection and message areas. It can be used to open or save a selected file. Although there is some variation in display, all File Librarian dialog boxes work in the same way.
At the top of a File Librarian dialog box are two lines of text, one indicating the purpose of the box and the second listing the current directory's path. Just below these lines is a highlighted data entry box that permits keyboard entry of the filename you want to select. Up to 1024 characters can be entered to identify path and file. Standard UNIX wildcard characters may be used in the data entry box to specify a file or set of files, and environment variables are interpreted.
Below the data entry box is the scrolling list of files and subdirectories. Files in subdirectories of the current directory can be accessed by selecting the appropriate subdirectory from the scrolling list. The list is automatically updated with the contents of the subdirectory you select.
To the right of the scrolling list is a set of radio buttons to define how files are ordered in the scrolling list (alphabetical by filename or in chronological order). The action buttons labeled Dir Up and Home Dir facilitate moving among directories to search for files.
The Open File Librarian dialog box has a unique display for selected files. When you select a file by highlighting it, it appears both in the data entry box and in the Selected Files display area. A filename typed into the data entry box is added to the Selected Files list by clicking the Add button to the right of the display area. If you want to remove an entry from the Selected Files list, highlight the filename, then select the Remove button to the right of the display area.
Append and Replace radio buttons are located near the bottom of the dialog. They permit the addition of selected files to those already loaded into QUANTA or the replacement of all currently loaded MSF files.
At the bottom of the File Librarian dialog box are action buttons. When one of these buttons is selected, the information defined in the dialog box is implemented. These buttons typically are labeled Open and Cancel.
Use the following exercise to become familiar with basic procedures for using a File Librarian. The example uses the Open MSFs dialog box for opening an MSF.
1. Display the File Librarian.
Display the File pulldown and move the cursor over the Open function. With the function name highlighted, release the mouse button.
The Open MSF dialog box appears. The current directory is identified as accelrys_quanta in your home directory. The scrolling list contains one file entry, PEPTIDE.msf. This file was created and the MSF was copied to that directory in a previous exercise. (See "Setting up to run the tutorials" on page 9.)
2. Change directories within the File Librarian.
Select the Dir Up button. The Current Directory message changes to identify the directory path of the home directory. The scrolling list changes to display files and subdirectories located in the home directory.
Move the mouse so the cursor is located over the accelrys_quanta directory in the scrolling list. If the accelrys_quanta directory is not visible in the scrolling list, move the list up and down with the scrollbar until the directory is displayed.
Click the left mouse button. The directory name is highlighted, indicating it is selected. The Current Directory message changes to accelrys_quanta under the home directory. The scrolling list changes to list the files located in the accelrys_quanta directory.
3. Select the entry PEPTIDE.msf from the scrolling list
The PEPTIDE.msf name is highlighted in the scrolling list, indicating it is selected. The filename is also displayed in the data entry box and in the Selected Files scrolling list. Several files can be added to the Selected Files scrolling list one at a time, by clicking additional MSFs.
Alternatively, you may add PEPTIDE.msf to the Selected Files list by typing its name in the data entry box and selecting the Add button.
Select the Open action button at the bottom of the dialog box to confirm the file choices. The dialog box is closed and the PEPTIDE.msf structure is displayed in the viewing area.
The Molecule Management Table reports filename, number of atoms, activity, visibility, number of displayed atoms, number of residues, number of segments, line width, and style for each MSF that is open in QUANTA.
The Atoms column lists the number of active atoms in the open MSF.
The Active and Visible columns contain Yes/No toggles. All operations are allowed for active structures. For inactive structures, only operations that provide information but do not affect the integrity of the molecule are allowed. Visible structures appear in the viewing area regardless of activity status. Invisible structures do not appear in the viewing area. Both visible and invisible structures can be active.
The Displayed column reports the number of atoms in an MSF that are displayed in the viewing area. This number may or may not agree with the number in the Atoms column, since atoms may be active but not displayed.
Selecting the button in the upper-right corner of the window enlarges the window to display the rest of the columns. You can also scroll through the table columns.
Selecting a cell in any of the columns displays information in the textport. For example, if you select a cell in the Molecule column of a specific MSF, a summary description of the MSF is printed in the textport. It includes the structure's name, the number of selected atoms, the visibility status, the activity status, and the number of displayed atoms.
If you select Atoms, a list is printed in the textport including information on atom number, segment ID, residue ID, residue name, atom type, and xyz coordinates. Similar information is supplied when you select any cell in the other columns.
The following exercise demonstrates how the Molecule Management Table can be used.
Select the Molecule cell for PEPTIDE.msf. A summary description of PEPTIDE.msf is printed in the textport.
Select the Atoms cell for PEPTIDE.msf. The textport lists all atoms in the MSF. If your molecule is large, not all the information may be displayed in the textport. If this is the case, the textport listing stops with a prompt:
With the cursor in the window, press the letter q to stop the listing.
Select the Visible cell entry for PEPTIDE.msf. The visibility status changes from Yes to No, and the structure goes from being displayed to not being displayed in the viewing area.
Select the cell again, changing it back to Yes. The structure is redisplayed.
Select the Active cell for PEPTIDE.msf. The activity status changes from Yes to No, and the visual display of bonds changes for the MSF.
Select the Active cell again and return the MSF to its original state. The cell changes from No to Yes, and the bonds in the MSF visibly change, becoming brighter and thicker.
5. Select Displayed, Residues, and Segments cells.
Select the Displayed, Residues, and Segments cells for PEPTIDE.msf. As each cell is selected, additional information about the structure is displayed in the textport.
Select the Width cell to increment the bond line width by 1. On reaching 8, the line width cycles back to 1.
Select Close. You are prompted for a confirmation to close the MSF (verify by selecting the same cell again). The MSF is closed.
This molecule is made active and visible; all other molecules have their status changed to inactive and invisible.
When an MSF is opened in the QUANTA Molecular Modeling application, a graphic representation of the structure's atoms and bonds is displayed in the viewing area. QUANTA has a variety of display options that enable you to focus attention on particular parts or characteristics of a structure.
The default representations of bonds and atoms in QUANTA are as follows:
Additional information about editing a structure and customizing its display is available in Manipulating Molecular Displays and in Generating and Displaying Molecules, Chapters 1 and 2.
Many QUANTA operations require that an atom or set of atoms be picked before processing. When an atom is picked, an identification tag (ID) is displayed on the screen adjacent to the picked atom. This ID contains atom and residue information. Additional information is displayed in the textport. You can choose the information that you want to display in an atom ID. The procedure for choosing this information is described in the next exercise.
The QUANTA default for displaying an atom ID is to display the ID of the last-picked atom only. This preference can be changed by opening the Preferences menu and selecting ID Mode and Style, then making a selection from the pull-right menu.
Place the tip of the cursor over the end point of a bond. Click the left mouse button. The atom ID is displayed next to the atom, and information about the atom appears in the textport.
Move the mouse so the cursor is over a point where two bonds meet. Click the left mouse button. The ID for the first picked atom disappears, and an ID for your new pick is displayed. Information about this atom also appears in the textport.
Pick several other atoms in the structure. IDs are successively displayed as you move from one atom pick to another.
Go to the Preferences menu. Select ID Mode and Style. A pull-right menu appears.
Select Multiple IDs, then return to the viewing area and pick several atoms in succession. Each time you pick an atom, an ID is displayed. No IDs are removed as you continue to pick additional atoms.
Return to the ID Mode and Style pull-right menu. Select Repick Deletes. Click several IDs in the viewing area. They are removed.
4. Change the information displayed in IDs
A dialog box appears with the directive on the top line of the box:
Select the toggle selection boxes you want, then select the OK action button.
Return to the viewing area and click several atoms. The IDs that are displayed contain information that reflects the choices you made in the dialog box.
Bring the Geometry palette in front of the Modeling palette. All the tools on the Geometry palette are now visible. From the Geometry palette, select Clear ID. All remaining IDs are removed from the viewing area.
QUANTA provides several mechanisms for moving structures or parts of structures in 3D space. Each mechanism can perform transformation operations, such as rotations or translations, as well as clipping and scaling of the displayed structure.
The available mechanisms for moving structures are:
The dial emulators and the mouse provide all necessary transformation operations. Keyboard commands can be used to provide precise manipulations.
The button box, graphics tablet, and spaceball are optional hardware devices for Silicon Graphics machines that provide additional ways of performing the same operations. For information about using these devices, see Appendix B. For information on installing these devices, see the QUANTA Installation Guide and your system administrator.
Dial emulators are grouped logically into sets. Each emulator set is associated with a number from 1 through 9 or the letter A, B, or U. See the complete list of emulator sets and dials and their functions in Table 4.
Dial emulators that control vector quantities like translation, rotation, and scaling are affected by the position of the cursor over the emulator dials. For example, if you click the left side of the X-rotation emulator dial using any mouse button, the structure in the viewing area rotates clockwise. Pressing and holding the button while dragging the mouse to the left results in continuous clockwise rotation that increases in speed as the cursor moves farther left.
Clicking the right side of the dial rotates the structure counterclockwise. Dragging the mouse to the right with the mouse button depressed results in continuous counterclockwise rotation that increases in speed as the cursor moves farther right.
Work through the following exercises to become familiar with dial emulator operation.
1. Rotate the displayed structure about the z axis.
Move the mouse so the cursor is over the left side of the Z Rotate dial. The cursor changes to a double arrow.
Press and hold the left mouse button. The structure starts rotating clockwise around the z axis. The axes displayed in the upper-left corner of the viewing area rotate with the structure.
Release the mouse button. The structure and the axes stop rotating.
2. Change direction and speed of rotation.
Move the mouse so the cursor is over the right side of the Z Rotate dial. Press and hold the left mouse button. The structure starts rotating counterclockwise around the z axis.
As you continue to press and hold the left mouse button, move the cursor back to the middle of the Z Rotate dial. The rotation slows, then stops.
As you continue to press and hold the left mouse button, move the cursor to the left of the Z Rotate dial. The rotation starts again slowly clockwise.
Move the cursor towards the left edge of the Z Rotate dial. The speed of the clockwise rotation increases.
Move the cursor completely out of the Z Rotate dial in a direct line to the left. The rotation continues at an even faster rate.
Release the mouse button. The structure and axes stop rotating.
Move the cursor over the Scale dial. Press and hold the left mouse button as you move the cursor to the right of center. The molecule enlarges.
Move the cursor to the left of center and watch the structure become smaller.
4. Move the structure through a clip zone
Move the cursor over the Clip dial, a little left of center. Press and hold the mouse button as you move the cursor to the left until some of the atoms in your structure disappear. Release the mouse button.
You have narrowed the depth of the slice along the z axis within which parts of your structure are visible.
Move the cursor over the Z Translate dial. Using this dial, move the structure back and forth along the z axis, observing different slices of the structure in the clip zone.
5. Return the structure and axes to their original orientation
Transformations can also be performed using a combination of keyboard keys and mouse buttons. Mouse transformations move the structure at the same speed and in the same direction that the mouse is moved. Mouse and keyboard actions that give equivalent movements as a specific dial emulator are listed in Table 4.
In addition, commands such as ROT X 90 (rotate 90 degrees around the x axis) can be used to provide precise manipulations of structures. Consult the QUANTA Command Dictionary for more information.
Do these exercises to practice using the mouse and keyboard to move your structure.
1. Rotate the displayed structure about the xy axes
Move the mouse so the cursor is in the viewing area. Press and hold the middle mouse button. Move the mouse so the cursor moves around the viewing area.
The structure rotates at the same speed and in the same direction as the mouse. The axes, displayed in the upper-left corner of the viewing area, rotate with the structure.
Release the mouse button. The structure and axes stop rotating.
2. Rotate the displayed structure about the z axis
Move the mouse so the cursor is in the viewing area. Press and hold the right mouse button. Move the mouse so the cursor moves to the left side of the viewing area.
The structure rotates clockwise at the same speed as the mouse. The axes, displayed in the upper-left corner of the viewing area, rotate with the structure.
While continuing to press and hold the right mouse button, move the mouse so the cursor moves to the right side of the viewing area. The structure rotates counter-clockwise at the same speed as the mouse.
Release the mouse button. The structure and axes stop rotating.
3. Translate the displayed structure on the xy axes
Move the mouse so the cursor is in the viewing area. Press the <Shift> key and hold the middle mouse button simultaneously. Move the mouse so the cursor moves around the viewing area.
The structure moves about the viewing area at the same speed and in the same direction as the mouse.
Release the <Shift> key and the mouse button. The structure stops moving.
4. Return the structure to its original orientation
Select the Reset View dial on the Dial Emulator. The structure returns to its original orientation. Reset View in the Geometry pallet and the Reset View dial perform the same function.
Palettes contain tools that perform many operations. Palettes appear on the screen when the tools they contain may be needed. For example, when QUANTA is started, the program is automatically placed in the Molecular Modeling application, and the Modeling and Geometry palettes are displayed. These palettes contain commonly used QUANTA tools. Table 6 and Table 7 list selections on these palettes and provide brief descriptions of each.
QUANTA decides when and if a particular palette is displayed, depending on:
A function can be performed by making the appropriate selection from one or more palettes. Some selections remain active until they are manually turned off. Other selections are automatically turned off when the associated functions are complete. Depending on the palette and selections that you make, more than one selection can be made from a palette.
Some tools can become dimmed or grayed when others are active. These dimmed tools represent inappropriate choices based on what is currently selected. A tool cannot be selected when it is dimmed. Dimmed tools are restored to an active status when the selection of another palette tool no longer makes the dimmed tool an inappropriate choice.
Use the following exercise as practice for selecting and using palette tools. Before you do these exercises, make sure that you have selected Multiple IDs from the ID Mode and Style pull-right menu of the Preferences menu. All tools used in this exercise are on the Geometry palette.
1. Calculate the distance between atoms
On the Geometry palette, select Distance. The tool is checked and highlighted.
Pick an atom in the PEPTIDE.msf structure. The ID for the picked atom is displayed and additional information is reported in the textport.
Again, the atom ID is displayed and information is reported in the textport . In addition, a distance monitor is displayed as a dashed line between the two picked atoms. The distance between the atoms, measured in angstroms, is shown in the viewing area and reported in the textport.
Pick two more atoms. Another distance monitor is displayed between these atoms on the screen, and the distance is reported in the textport.
2. Calculate distances using Continuous Pick Mode.
3. Turn off Distance and Continuous Pick Mode.
Select Distance again. When you release the mouse button the tool is no longer checked and highlighted, indicating it is no longer selected. The distances between atoms and atom IDs remain displayed.
Select Clear IDs. All IDs are cleared from the viewing area but the distance monitors are still displayed.
5. Hide and show the distance monitors.
Select Show Distance Monitors. This tool, which by default is selected, is now turned off. The display of the distance monitors is turned off.
Select Show Distance Monitors again. This tool is highlighted. The distance monitors are again displayed.
6. Delete the distance monitors.
7. Calculate the angle between atoms.
An angle monitor indicating the angle formed by these atoms is displayed in the viewing area. The value of the angle is also reported in the textport. If the atom IDs obscure the angle monitors, use Clear ID to remove the IDs.
8. Calculate both distances and angles.
Select Distance. Both Distance and Bond Angle are now selected.
Pick two atoms. A distance monitor is displayed between these two atoms.
Pick a third atom for an angle calculation. An angle monitor is displayed. The third atom can also be the first atom in another distance calculation.
Select Show Distance Monitors and Show Angle Monitors to turn them off. Select Dihedral.
Pick four atoms in a new area of the structure to form the first torsion angle. A torsion monitor is displayed.
Pick four more atoms, thus forming a second torsion angle. A value is displayed, which represents the angle formed by the two planes.
10. Turn off all calculation selection. Delete monitors and IDs.
Select Dihedral to turn it off.
Select the Delete Distance Monitors, Delete Angle Monitors, and Delete Dihedral Monitors to delete monitors from the viewing area.
Colors are automatically assigned for different parts of the QUANTA interface. You can change the colors by using Dial Set 7 on the Dial Emulator or by opening the Preferences menu, displaying the pull-right menu for Color Definitions, and selecting Menu Colors.
Each color used in QUANTA is determined by the interaction of hue (the actual color), saturation (percentage of color), and intensity (percentage of light).
Hue values are based on a 360° color wheel, where red is assigned a value of 0° or 360°. Color changes occur in 1° increments. The six pure colors occur at 60° increments. Table 8 lists these colors and their color wheel hue value.
A mix of colors falls anywhere within the range. For example, red is defined as 0°, and yellow as 60°. Between red and yellow are 59 incremental shades of orange. The 30° position represents an orange color composed of equal amounts of red and yellow.
Saturation values, specified in decimal values from 0 to 1, determine the purity of a color by how much white it contains. For example, saturation values determine if a color with a hue value of zero is red (saturation = 1.000) or pink (saturation < 1.000). All pure colors have saturation values of 1 (100%).
Intensity values, specified in decimal values from 0 to 1, determine the brightness of the color by how much light it contains. For example, intensity values determine if a color with a hue value of 240 is blue (intensity = 1.000) or dark blue (intensity < 1.000). Black has the intensity value of 0.
Hue, saturation, and intensity parameters that define each structure color are stored in the constants file filename.cst.
In adjusting colors, you can adjust all three parameters - hue, saturation, and intensity. These three values combine to produce the actual display color. Table 9 provides several examples.
|
0
|
0.000
|
1.000
|
White
|
|
0
|
0.500
|
1.000
|
Light pink
|
|
0
|
1.000
|
0.500
|
Dark red
|
|
0
|
1.000
|
0.000
|
Black
|
Table 10 lists the choices in the dialog box that appears when you choose Menu Colors from the Color Definitions pull-right menu in the Preferences menu. The table describes the function or the default color setting and lists the dial equivalent for each dialog box selection.
Do the following exercises to practice adjusting menu colors.
Select Dial Set 7 in the dial emulator selection box located at the bottom of the Dial Emulator window. The menu color dials are displayed.
2. Define the hue for menu color dial 2, that defines the background color for text areas
Move the cursor to the left side of the H box of dial emulator 2. Click the left mouse button.
The message line displays the current values of hue, saturation, and intensity for color 2.
With the cursor over the H, press and hold the left mouse button.
The hue changes for both dial emulator 2 and the background for text areas of the menu bar, palettes, dialog boxes, and the message line. The text of the command line is also affected. The hue value, displayed in the message line, decreases to reflect the change in the display. When this value reaches zero, it automatically changes to 360 and begins to decrease in value again. The hue of dial emulator 2 and the hue of the text areas continue to change relative to the hue value.
Move the cursor to the right side of the H box.
The hue of dial emulator 2 and the hue of the text areas continue to change. However, the hue value displayed in the message line is now increasing as the color changes.
3. Define saturation for menu color 2
Move the cursor to the left side of the S box of dial emulator 2. With the cursor over S, press and hold the left mouse button.
The saturation changes for both dial emulator 2 and the text areas, darkening as the saturation value displayed in the message line decreases. When this value reaches 0.01, it automatically stops, as does the color change.
The saturation of dial emulator 2 and the saturation of the text areas resumes changing. However, the color is now lightening and the saturation value is increasing. When the saturation value reaches 1.000, it automatically stops, as does the color change.
4. Define intensity for menu color 2
Move the cursor to the left side of the I box of dial emulator 2. Press and hold the left mouse button.
The intensity changes for both dial emulator 2 and the text areas. The intensity value, displayed in the message line, decreases to reflect the change in color. When this value reaches 0.01, it automatically stops. The intensity of dial emulator 2 and the intensity of the text areas also stops changing.
The intensity of dial emulator 2 and the intensity of the text areas resumes changing. However, the value is now increasing. When the intensity value reaches 1.00, it automatically stops. The intensity of dial emulator 2 and the intensity of the text areas also stops changing.
Select Dial Set 1 in the dial selection box located at the bottom of the Dial Emulator window. The menu color dials are replaced by dial set 1.
Use the next exercises to practice defining menu colors using menu selections.
1. Display the dialog box containing menu color options.
Display the Preferences menu. Select Color Definitions from the menu and open its pull-right menu. Select Menu Colors. A dialog box is displayed that contains options for customizing menu colors.
2. Define the hue, saturation, and intensity for the background color of the viewing area.
A dialog box containing data entry fields for hue, saturation, and intensity of the background color is displayed. Each entry box contains the currently set value.
Enter the values 300 for hue, 0.75 for saturation, and 0.50 for intensity, then click the OK button.
The background color of the viewing area is changed to reddish purple.
The dialog box containing available color options for the QUANTA window areas is redisplayed.
3. Return menu colors to their default settings.
The background color of the viewing area is returned to its original hue, saturation, and intensity. Since the function resets any menu colors that were changed during the session, the color of the text areas is also returned to its original value.
The dialog box containing available color options for the QUANTA window areas is redisplayed.
You also can reset menu colors by selecting Reset All in the Color Definitions pull-right menu. This selection also resets any other color changes, such as atom colors, you made. If you do not reset menu colors to the default settings, the menu and window color settings you chose are retained in future sessions.
The QUANTA interface, including menus, dialog boxes, and the mouse, eliminates the need for you to remember complex commands and minimizes use of the keyboard. Some keyboard entry is required to enter data in dialog boxes.
QUANTA contains command equivalents for all Molecular Modeling functions and for some functions in other applications. These commands can be used as an alternative to making selections from menus and dialog boxes.
With the QUANTA standard interface, you must use the keyboard to enter information into data entry boxes. You can also use it to accelerate the process of selecting dialog boxes and executing functions. When you type characters on the keyboard, they are automatically entered into the highlighted data entry box of the open dialog box. The cursor does not need to be over the highlighted box for you to place characters into it.
You can accelerate the process of executing a dialog box by substituting the <F1> (enter) and <F2> (escape) keys for mouse selections.
Using the <Tab> key moves you sequentially through data entry boxes. Each box is highlighted as it become active. When you reach the last box, pressing <Tab> again returns you to the first box.
You also can use the keyboard to enter commands on the command line. The cursor does not need to be over the command line to enter commands, but it does need to be in the Molecule window. As you type, commands are shown on the command line. Dialog boxes prompt for any missing information. Commands can only be entered when a dialog box is not displayed.
Using commands permits you to execute operations without displaying menus and dialog boxes. Commands can be entered using uppercase or lowercase characters, and they can be abbreviated to the first four characters of the command.
Command-driven QUANTA provides a secondary command input mode that displays command information in the textport instead of in dialog boxes. This mode is entirely non-graphical.
Commands can be executed in command-driven mode. However, commands are organized differently from menu selections. To enter command-driven mode, type:
> set dbox off
> set dbox on
See the QUANTA Command Dictionary for more information about using commands and for a complete list of QUANTA commands.
Complete the following exercises to practice using keyboard commands.
1. Display the About QUANTA dialog box with a keyboard command.
Place the cursor anywhere in the Modeling window and type the command:
The characters appear on the command line as they are typed.
Press the <Enter> key to activate the command.
The characters are erased from the command line, and the command is sent to QUANTA. The About QUANTA dialog box is displayed.
2. Use keyboard commands to remove the About QUANTA dialog box.
Press the <F1> key to select the Continue button in the dialog box. The dialog box is removed from the screen.
3. Change the QUANTA display with keyboard commands
QUANTA provides a function that changes the color of the contents of the dials, palettes, menu bar, structure name, command line, message line, and textport to the current background color. Adjustment of these colors is useful in generating presentation slides or printouts of structures. This function can be accessed using keyboard commands.
Press <F4>. The viewing area is enlarged to full-screen size and all other windows are hidden. Press <F4> again. The viewing area returns to normal. <F4> is an on-off toggle for Photo Mode. This function is similar but not identical to Blackout Text Area on the Menu Colors dialog box.
QUANTA commands can be bound to function keys on your workstation keyboard. Function keys <F3> through <F12> can be redefined. Either a single command or a pair of commands can be bound. For a single command, every time the function key is pressed, the command you associated with the key is sent to QUANTA. For two commands, the commands are sent alternatively to allow toggling.
By default, function key bindings are defined by the file $HYD LIB/function key.dat. To view the default settings, open the Information menu in the menu bar. Select Current Session to open a pull-right menu and select Function Keys. The function key bindings are listed in the textport.
The $HYD_LIB/funkey.ps PostScript file can be printed out and taped to your keyboard above the function keys to show the default bindings.
Complete the following exercise to become familiar with the procedure for assigning your own key bindings.
Open the Preferences menu in the menu bar. Select Device Settings to open the pull-right menu.
Select Function Keys from the menu. A dialog box is displayed with a default number 3 in the data entry box.
Enter 5 in the box to select function key 5 as the key to be defined.
Another dialog box is displayed asking:
A third dialog box is displayed, requesting:
Enter the command this key will send.
When you complete the last step in defining <F5>, the dialog box for specifying the function key number to be defined is redisplayed with the number 5 as the default.
The next dialog box is displayed, asking:
A third dialog box is displayed, requesting:
Enter the command this key will send.
The dialog box for specifying the function key number to be defined again is displayed, this time with the number 6 as the default.
The next dialog box is displayed, asking:
The third dialog box is displayed, requesting:
Enter the command this key will send.
Another data entry dialog box is displayed.
4. Save your changes to a local directory
Finish the definition process by clicking Cancel in the last dialog box for <F7>. A final dialog box is displayed with saving selections.
QUANTA provides two methods of accessing your workstation's operating system when you are running QUANTA. The first is to open a standard workstation window. The second is to enter single operating system commands on the Command Line. This makes it possible to perform many operating system functions without exiting QUANTA. If you want to use any UNIX commands that require input, they must first be added to the STRINGTABLE in the $QNT_ROOT/resources/core_quanta.res file by your system administrator.
To execute operating system commands on a workstation, you must create a standard workstation window. This window is manipulated in the same manner as any standard workstation window.
Use the following exercise to familiarize yourself with the procedure for reaching the operating system from QUANTA.
A standard system window is displayed on the screen. The current directory in this window is the same as the directory from which QUANTA was started, for example, accelrys_quanta. All environment variables set in the startup window are also the same.
Move the mouse so the cursor is in the system window. You can now enter system commands in the system window.
Iconify the system window by moving the cursor to the upper- right corner of the window and selecting the iconify button or close the window by typing exit within it. The system window is cleared from the screen to an icon at the top of the QUANTA screen or is removed completely.
A single specific operating system command can be entered on the QUANTA command line. QUANTA passes the command to the workstation operating system. When the operating system has completed executing the command, the results are passed back to QUANTA and reported in the textport.
To pass a command to the operating system, the operating system command must be preceded with the QUANTA command:
If you enter this command, or if you use the vi, view, or emacs commands without adding an operating system command, QUANTA displays a system window.
QUANTA commands are case insensitive, but system commands must be entered using proper case.
Use this short exercise to practice command-line access to the operating system.
Pass the pwd command to the operating system.
UNIX>pwd
is displayed in the textport, indicating that the print working directory command has been sent to the operating system.
When the system finishes processing the pwd command, your current directory path is displayed in the textport.
Your work and current preferences are automatically saved when you exit QUANTA. The .cst file and currently open MSFs are saved into a common file when you select Save Status from the File menu.
To exit QUANTA, display the File menu and select Exit QUANTA. QUANTA windows are removed from the screen and you are returned to the system.
QUANTA is a windows-based application that supports importing, creating, and editing molecular structures and computer-based experimental simulation and analysis. The power of QUANTA is its ability to handle extensive and complex data about structures and to translate that data into graphic representations.
As a starting point for learning QUANTA, this chapter covered its basic layout and design and the fundamental procedures for getting started. In particular, the chapter described how to use the QUANTA interface - windows, menus, palettes, dialog boxes, dial emulators, the keyboard, the mouse, and the Molecule Management table - to display and move structures and obtain information about them.
Table 11 generalizes and summarizes information in this chapter on making selections in QUANTA.