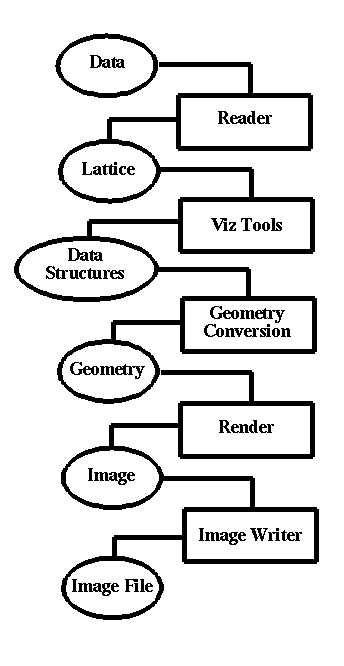


The Visualization Pipeline
Here are the important steps in the scientific visualization pipeline.
These steps are not always as rigidly defined as they appear
from this diagram. For example, if you are writing a program that
generates an image from realtime, simulated data, you won't need
a "Reader" and you can skip over the steps referring to geometry.
The process of colormapping the data is considered to be the "Viz Tools" step.
In general, though, unless you
are a programmer, you will spend most of your visualization time using an
application which reads the data. In either case, knowing the organization
can be very helpful.


