
H.S. Doris Mei and David F. Coker
Department of Chemistry
Boston University
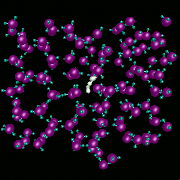
The transport of H2 in liquid water is studied using adiabatic, nonadiabatic, and classical molecular dynamics methods in an attempt to understand the influence of transitions between translational states of the H2 molecule driven by solvent fluctuations. The video shows results from nonadiabatic dynamics calculations where we see the effects of these quantal transitions. Quantum autocorrelation functions of the H2 center-of-mass velocity are computed in various dynamical limits. We find that there are strong nonadiabatic couplings between the instantaneous adiabatic translational states of H2 in water which result in rapid decorrelation of the H2 center-of-mass velocity for the time evolving translational mixed state. Transitions to excited translational states reduce the effects of caging dynamics in the velocity autocorrelation function dramatically. Classical and adiabatic descriptions of the dynamics predict that caging is much more important than we find nonadiabatically. The diffusion constants we obtain from these nonadiabatic calculations agree well with experimental results. Results obtained from other methods can be as much as a factor of two different from experiment.
 Video Sequence / GIF / RGB
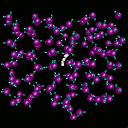
Non-adiabtic H2 in ice at T=250K
 Video Sequence / GIF / RGB
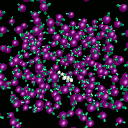
Non-adiabtic H2 in water at T=300K
Back to the SCV Home Page